
Communicating with an Eyetracker
PsychoPy has components that allow you to connect and communicate with eyetrackers directly from Builder - without any code! These steps will guide you through how to set up, calibrate, and record from your eyetracker.
Step one: Select your plugin
If you are using a version of PsychoPy from 2022 or earlier, skip this step and go straight to step two
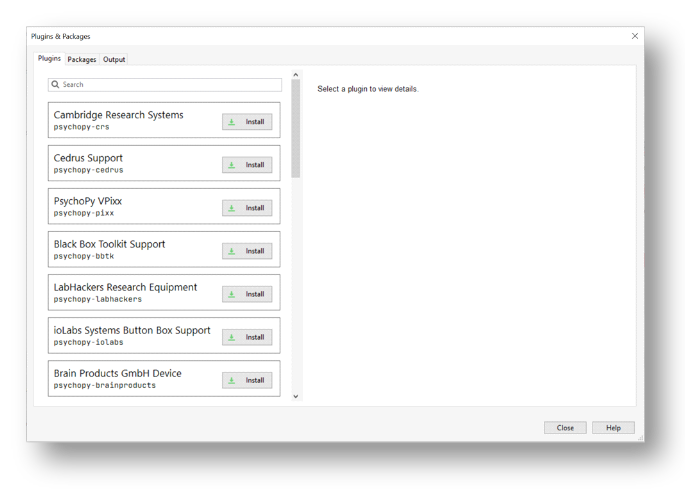
To use your eye tracker, you will need to install a plugin. PsychoPy supports many of the commonly used eye trackers. To find out whether yours is supported, follow these steps:
Under the Tools tab, select Plugin/packages Manager
Find your eye tracker in the plugins list and select install
If you would like to install a plugin from a file (e.g. a .whl file):
In the Plugin and Packages Manager, select the Packages tab
At the bottom left of the window, select whether you would like to install from a file or via the PIP terminal
Select the relevant file or run a PIP install
Restart PsychoPy to use the newly installed plugin
To find out more about plugins, visit our plugins website
Step two: Know Your Eyetracker
PsychoPy supports many of the commonly used eyetrackers, you can find out if yours is supported by following these steps:
Click on the Experiment Settings icon (the one that looks like a cog, near the top left-hand side of the Builder window).
Click on the Eyetracking tab:
The SR Research option is also known as Eyelink, so if you have an Eyelink device this is the option to choose.
When you’ve found your eyetracker, just select it and click OK.
If you want to test out your eyetracking experiment but don’t have an eyetracker with you, you can select MouseGaze. This will allow your mouse cursor to act as a gaze point on your screen, and so allow you to simulate eye movements without using an eyetracker. Then, when you’re ready to use your eyetracker, you can just select it from the Experiment Settings and run your experiment in the same way.
Step three: Set up your Eyetracker
When you’ve selected your eyetracker from the drop-down menu, a set of options that are specific to that device will appear, such as the model and serial number of your device. Here we will follow through with the MouseGaze options:
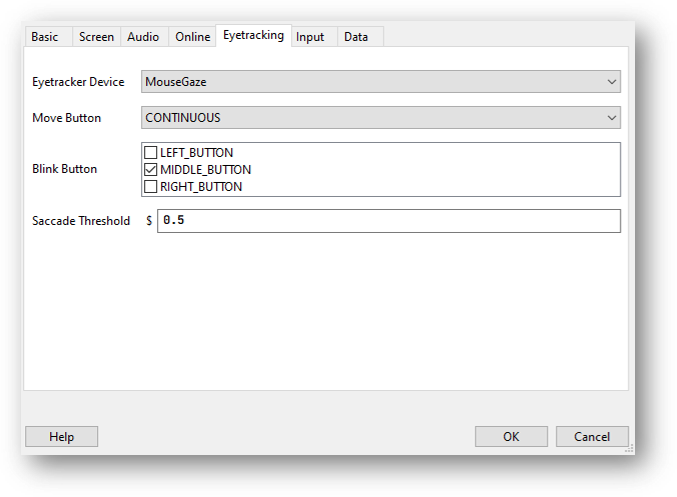
Choose which mouse button you’d like to use to simulate blinks by clicking on the boxes.
The Move Button option allows you to select whether PsychoPy monitors your mouse movement continuously, or just when you press and hold one of the mouse buttons.
The Saccade Threshold is the threshold, in degrees of visual angle, before a saccade is recorded.
EyeLink
When setting up your EyeLink you will first need to make sure you have the following set up:
An “Experiment” computer (this is the computer the experiment is run on) - set the IP address of this computer to 100.1.1.2
A “Host” computer (this is the computer where the EyeLink software runs) - set the IP address of this computer to 100.1.1.1
In your PsychoPy Experiment Settings > Eyetracking ensure you have SR Research selected, in the IP address use 100.1.1.1 (the IP of the host computer).
Before any communication can happen between the eyetracker and your experiment, the two computers must be connected via an ethernet cable and you need to check the two devices can communicate with one another. You can check the connection by opening the command prompt/terminal on the experiment computer and typing ping 100.1.1.1 if the connection is successful you will see that the pings are successfully returned. If you have trouble connecting at this phase you will want to trouble shoot by searching the returned error message.
Sometimes different eyetracking systems will have their own set of “screens” or “protocols” that they present. These are independant of what we can currently control from PsychoPy, which means that if you have made your experiment using MouseGaze, then move to the lab with the EyeLink and change the eyetracker to SR Research the instructions that you see at the start of the calibration may appear a little different to what you were expecting!
The general protocol you will see is shown below.
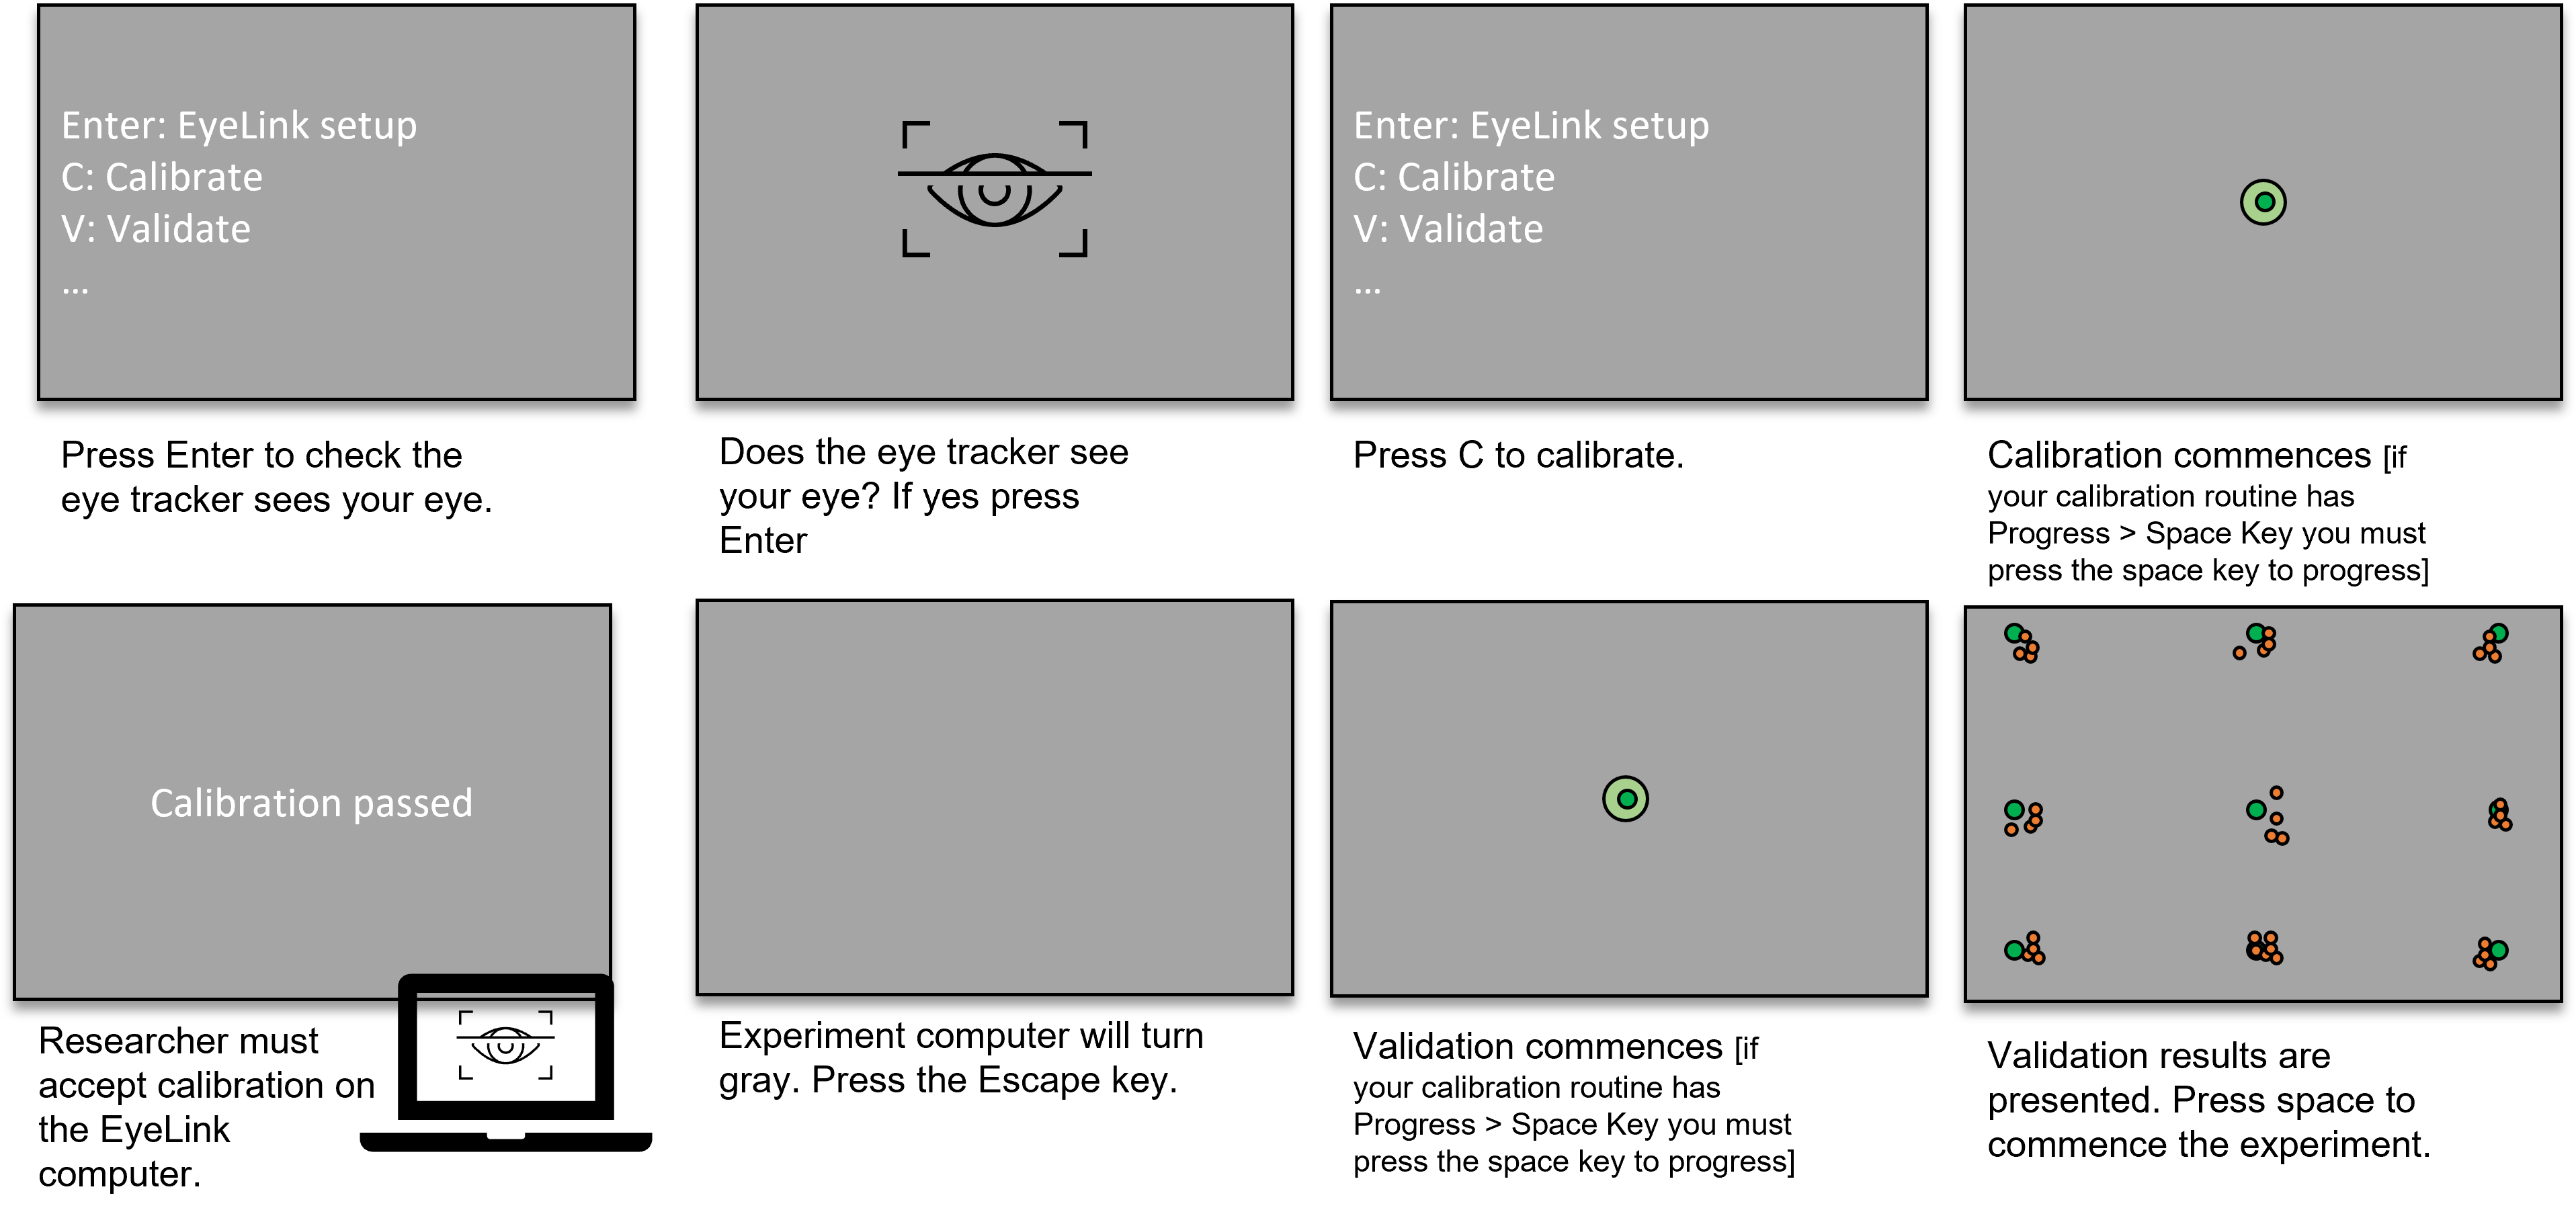
Fig. 41 The set of screens that will appear on your experiment presentation screen during calibration/validation, and what to press when. If pressing the Escape key does not work, try pressing the ‘O’ key.
For further information about EyeLink installation and use, look at SR Research’s learning resources
Tobii
When plugging in your Tobii you will first want to download and install the free Eyetracker Manager software. We’de recommend conducting a quick calibration using that software so that you arre confident that your Tobii is connected and working, independantly of your PsychoPy experiment.
In PsychoPy, then click “Experiment Settings” > “Eyetracking”. Select “Tobii Technology” in the Eyetracker device drop down and write the name of your device (e.g. “Tobii Pro Nano”, “Tobii Pro Fusion”, “Tobii Pro Spectrum”, “Tobii TX300”). The other settings in this section are optional.
Step three: Add Eyetracker components to your Builder experiment
You can find the eyetracker components in the eyetracker component drop-down on the right-hand side of the Builder window.
The first component to add is the ‘Eyetracker Record’ component as this starts and stops the eyetracker recording. Usually, you would add this component to your instructions routine or something similar, so that your eyetracker is set off recording before your trials start, but you can add them in wherever makes sense for your experiment:
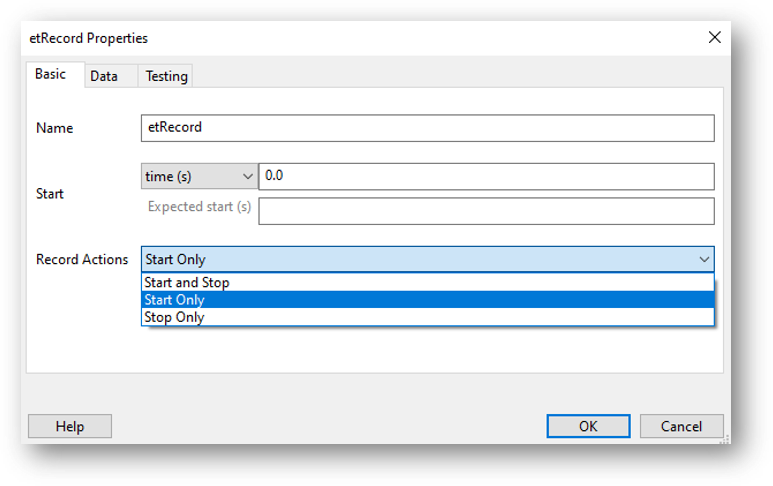
Fig. 42 You can choose whether you want this component to just start your eyetracker recording, just stop the recording, or whether you want the component to start the recording and then stop it after a certain duration.
Note
If you’ve started the eyetracker recording at the start of your experiment, be sure to add in another eyetracker record component at the end of your experiment to stop the recording too!
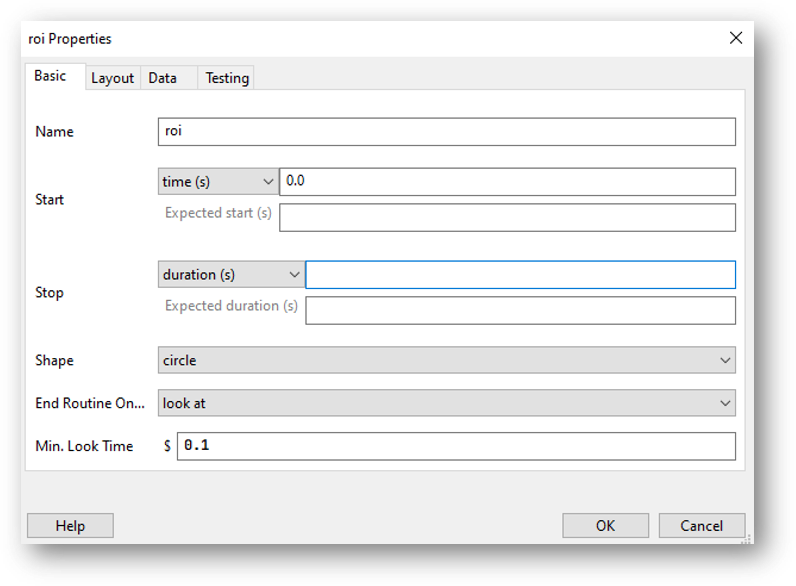
If you want to record information on gaze position, or you want your trial to move on when your participant has looked at or away from a target, you’ll need to add in an ROI component. The ROI component has lots of options - you can choose what you want to happen when the participant looks at or away from a certain part of the screen, what shape your ROI is etc. All of which can also be defined in your conditions file, just like any other component. Choose the options that fit the needs of your experiment. Here, the component is set such that when a participant looks at a circular target for at least 0.1s (set by the min look time), the trial will end:
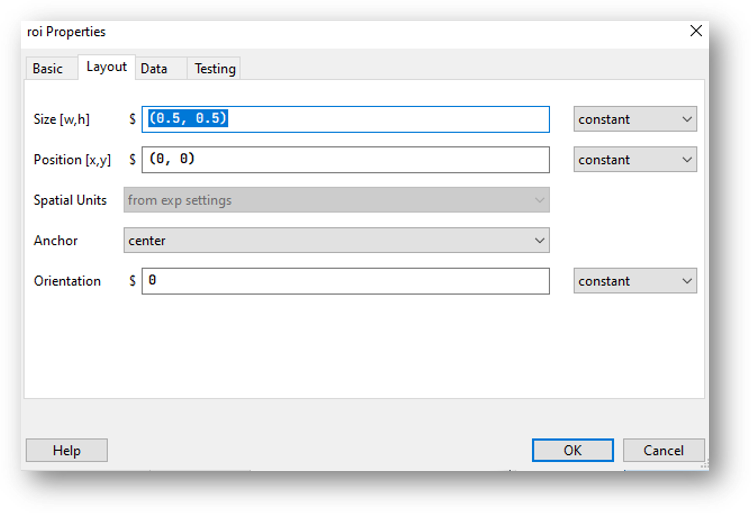
On the layout tab of the ROI component, you set the position and size of the ROI in the same way as you would set the position of any visual component:
It’s also vitally important that you calibrate and validate your eyetracker. To do this, you will use two standalone components: Eyetracker calibrate and Eyetracker validate.
These are a little different from other components in that they form a routine all on their own. You’ll need to add them in right at the start of your experiment Flow.
The Eyetracker calibrate component has all of the options you would expect from an eyetracker calibration:
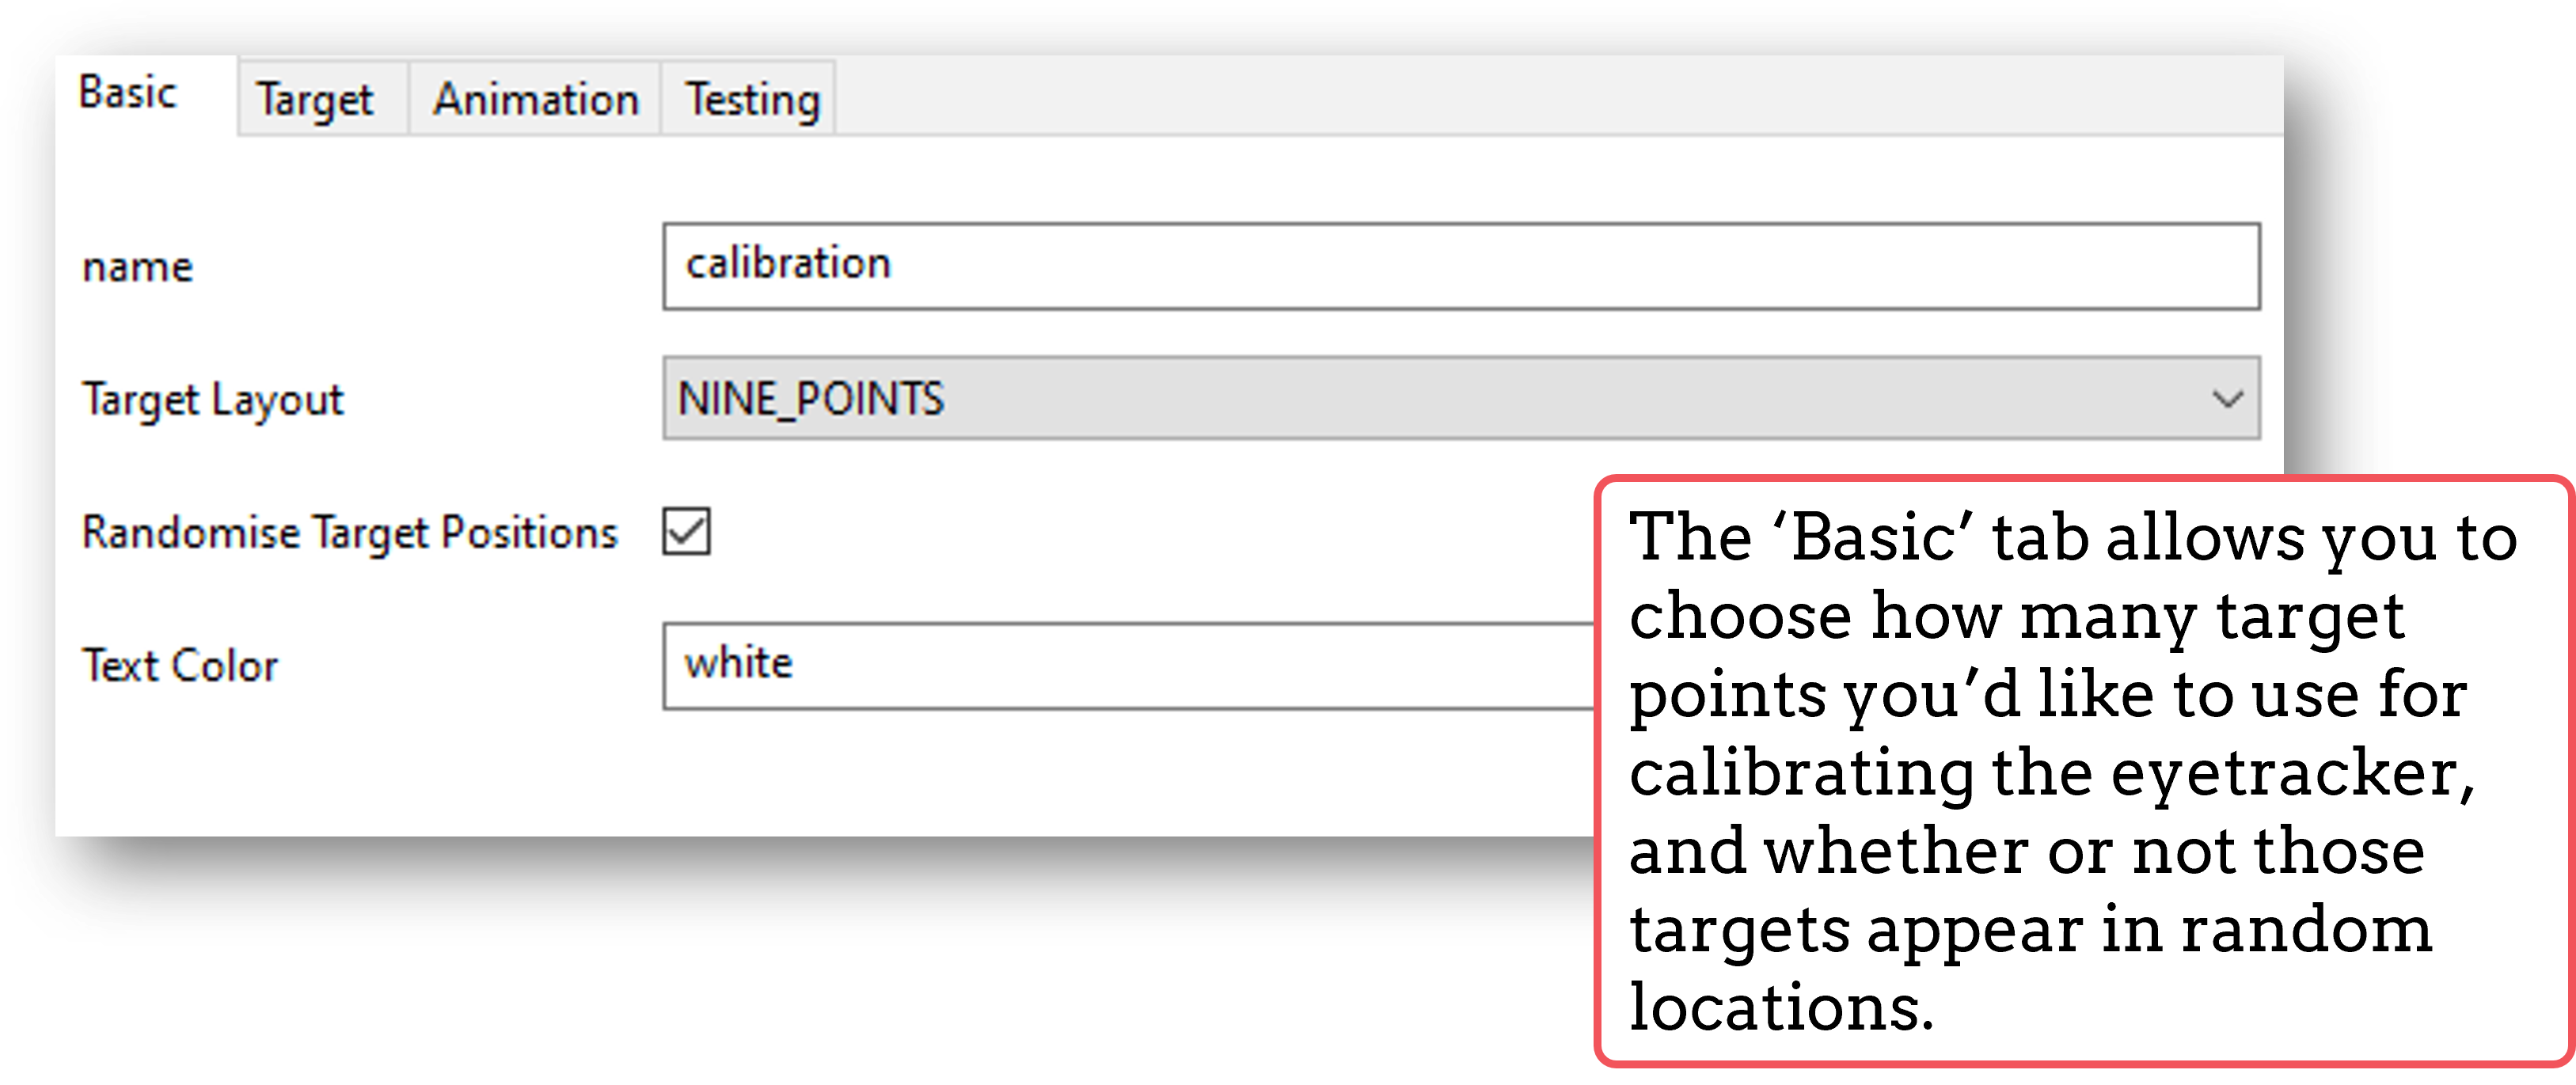
Fig. 43 Set the basic properties of the calibration routine here.
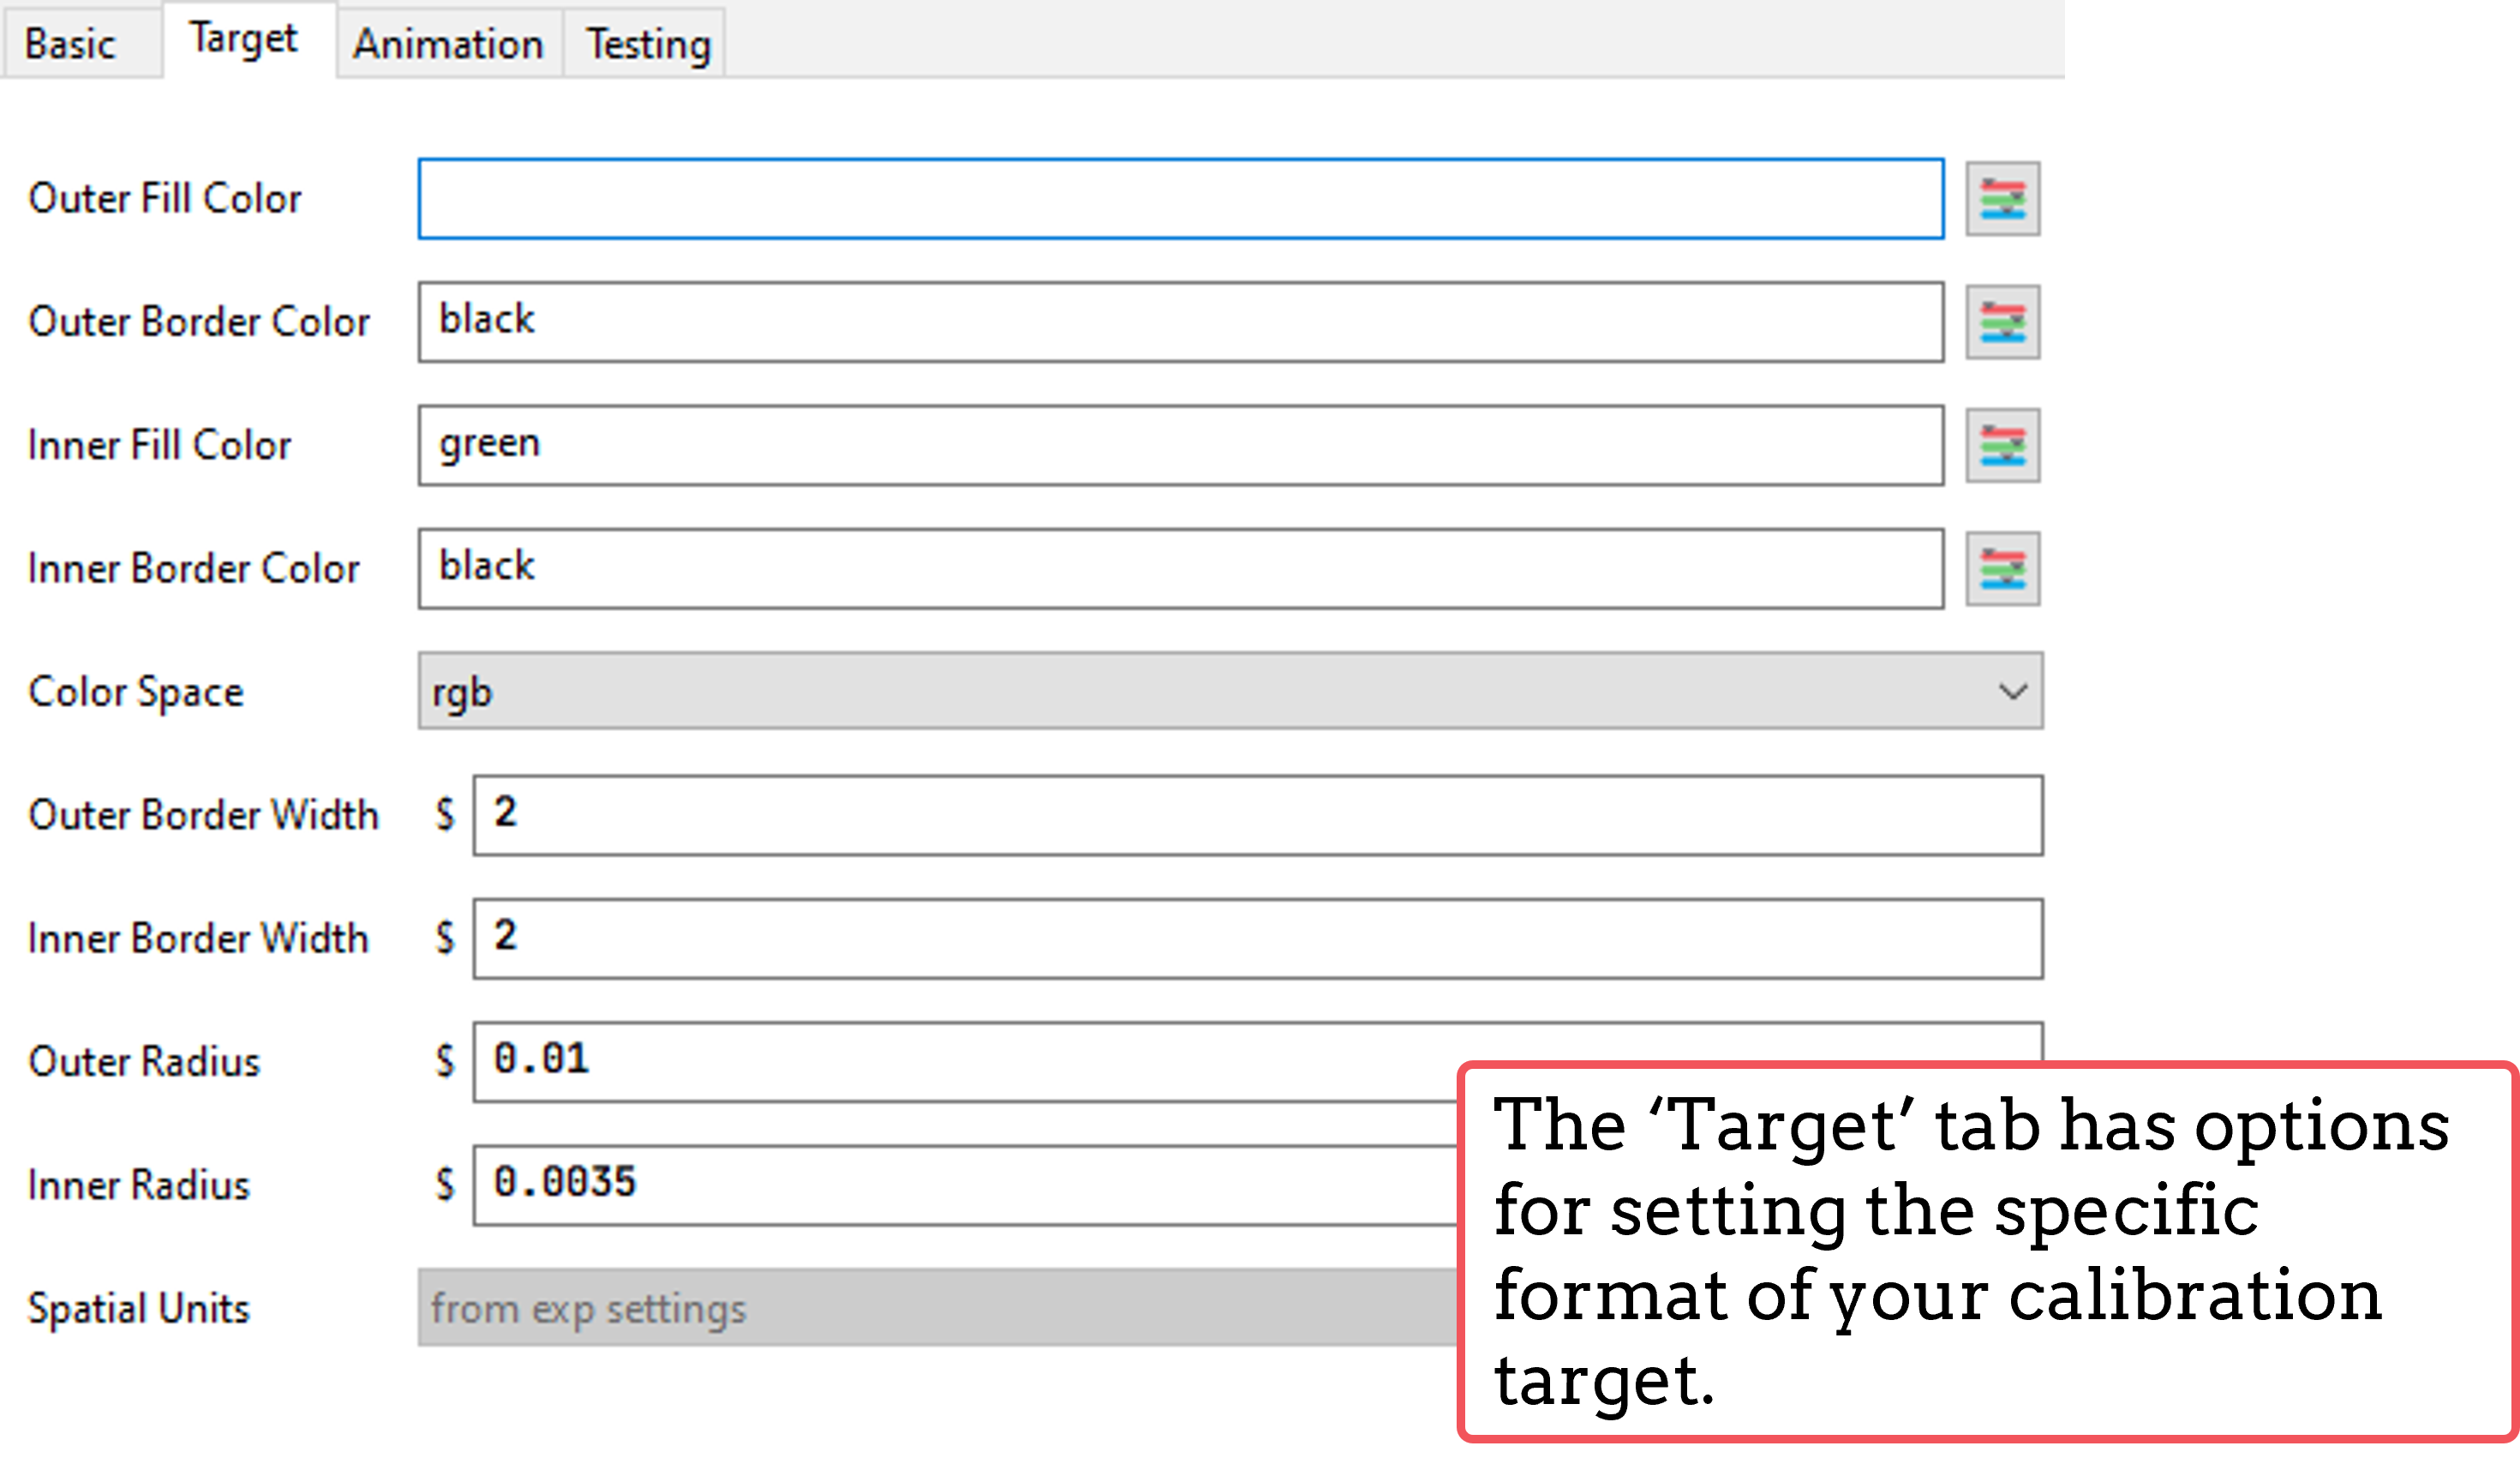
Fig. 44 Set the properties of the target on this tab.
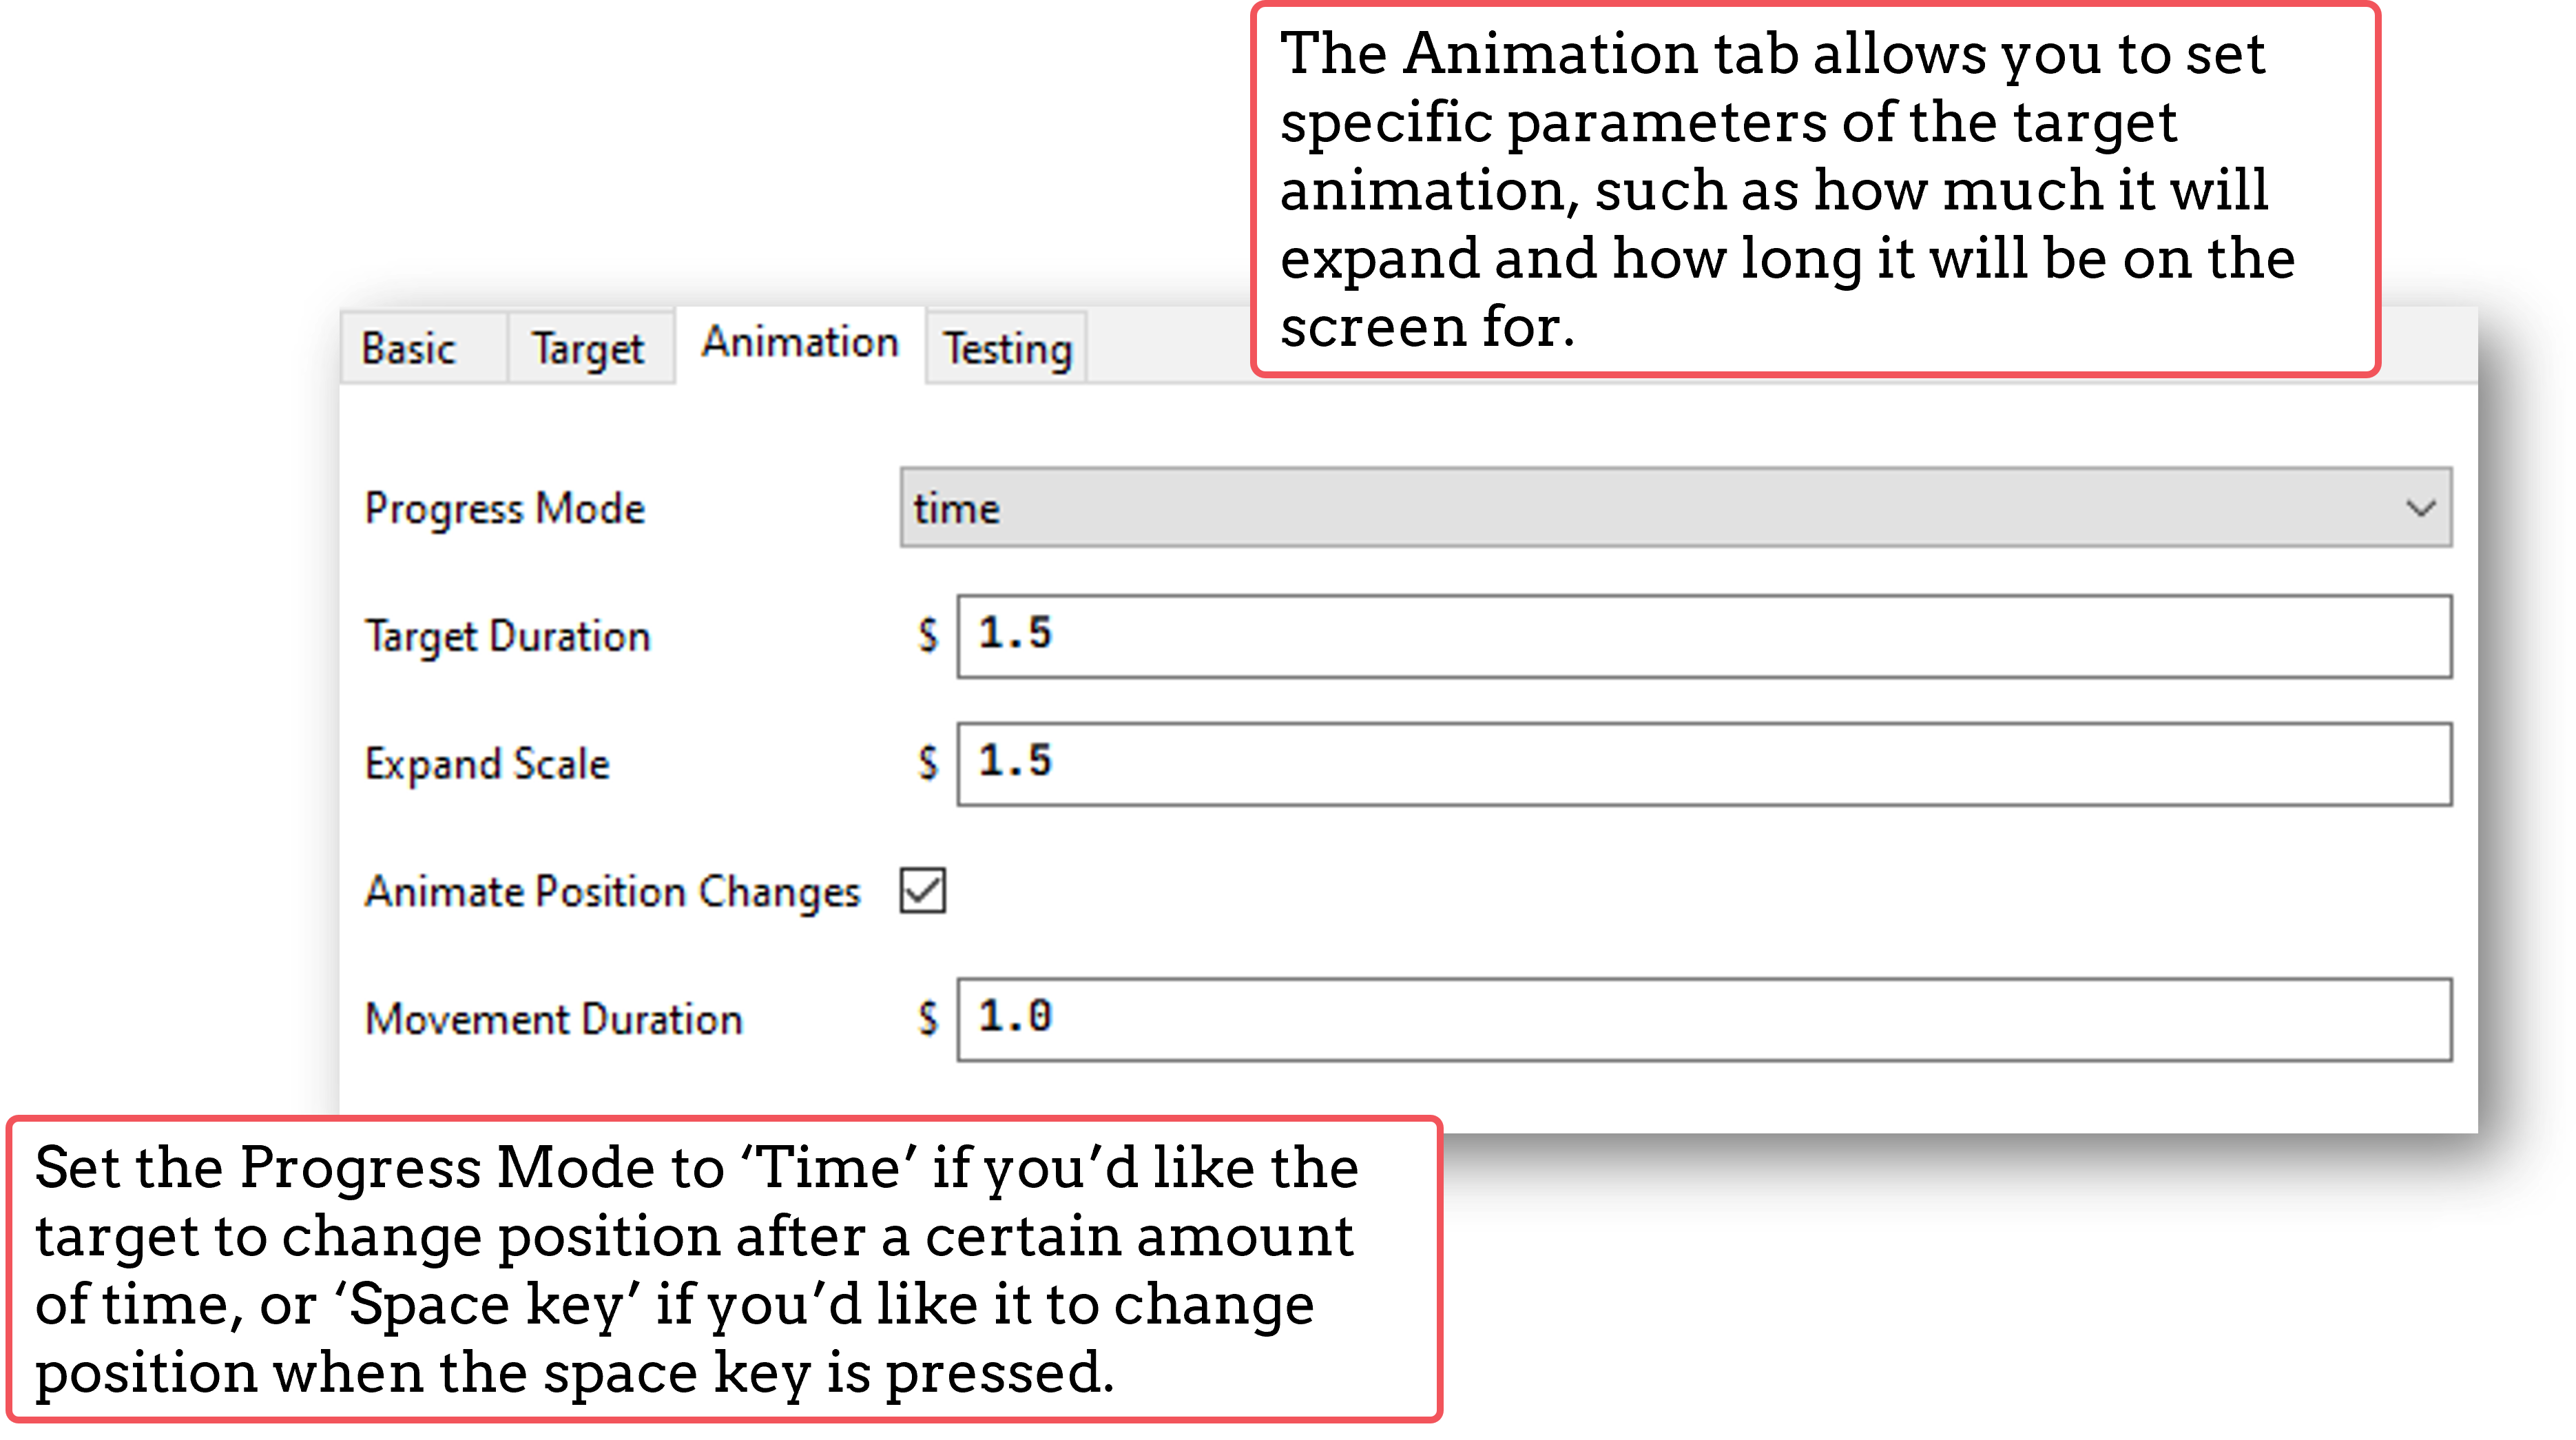
Fig. 45 This tab allows you to set the properties of the target animation.
The Eyetracker validate component, you’ll notice, is pretty much identical to the calibration component - that’s because it will use the calibration information to present the same screen to the participant to cross-check the recorded gaze position with the calibrated gaze position.
The Eyetracker validate component will then show the offset between the recorded and calibrated gaze positions. You’ll want these to be as close as possible to ensure that your eyetracker is recording gaze accurately.
What about the data?
The eyetracking data from the ROI will be saved in your usual data file. Extra columns are created and populated by PsychoPy, depending on what you’ve asked to record.
In the example below, the trial ended when a participant looked at a target on the screen. You can see what each column represents in the figure below:
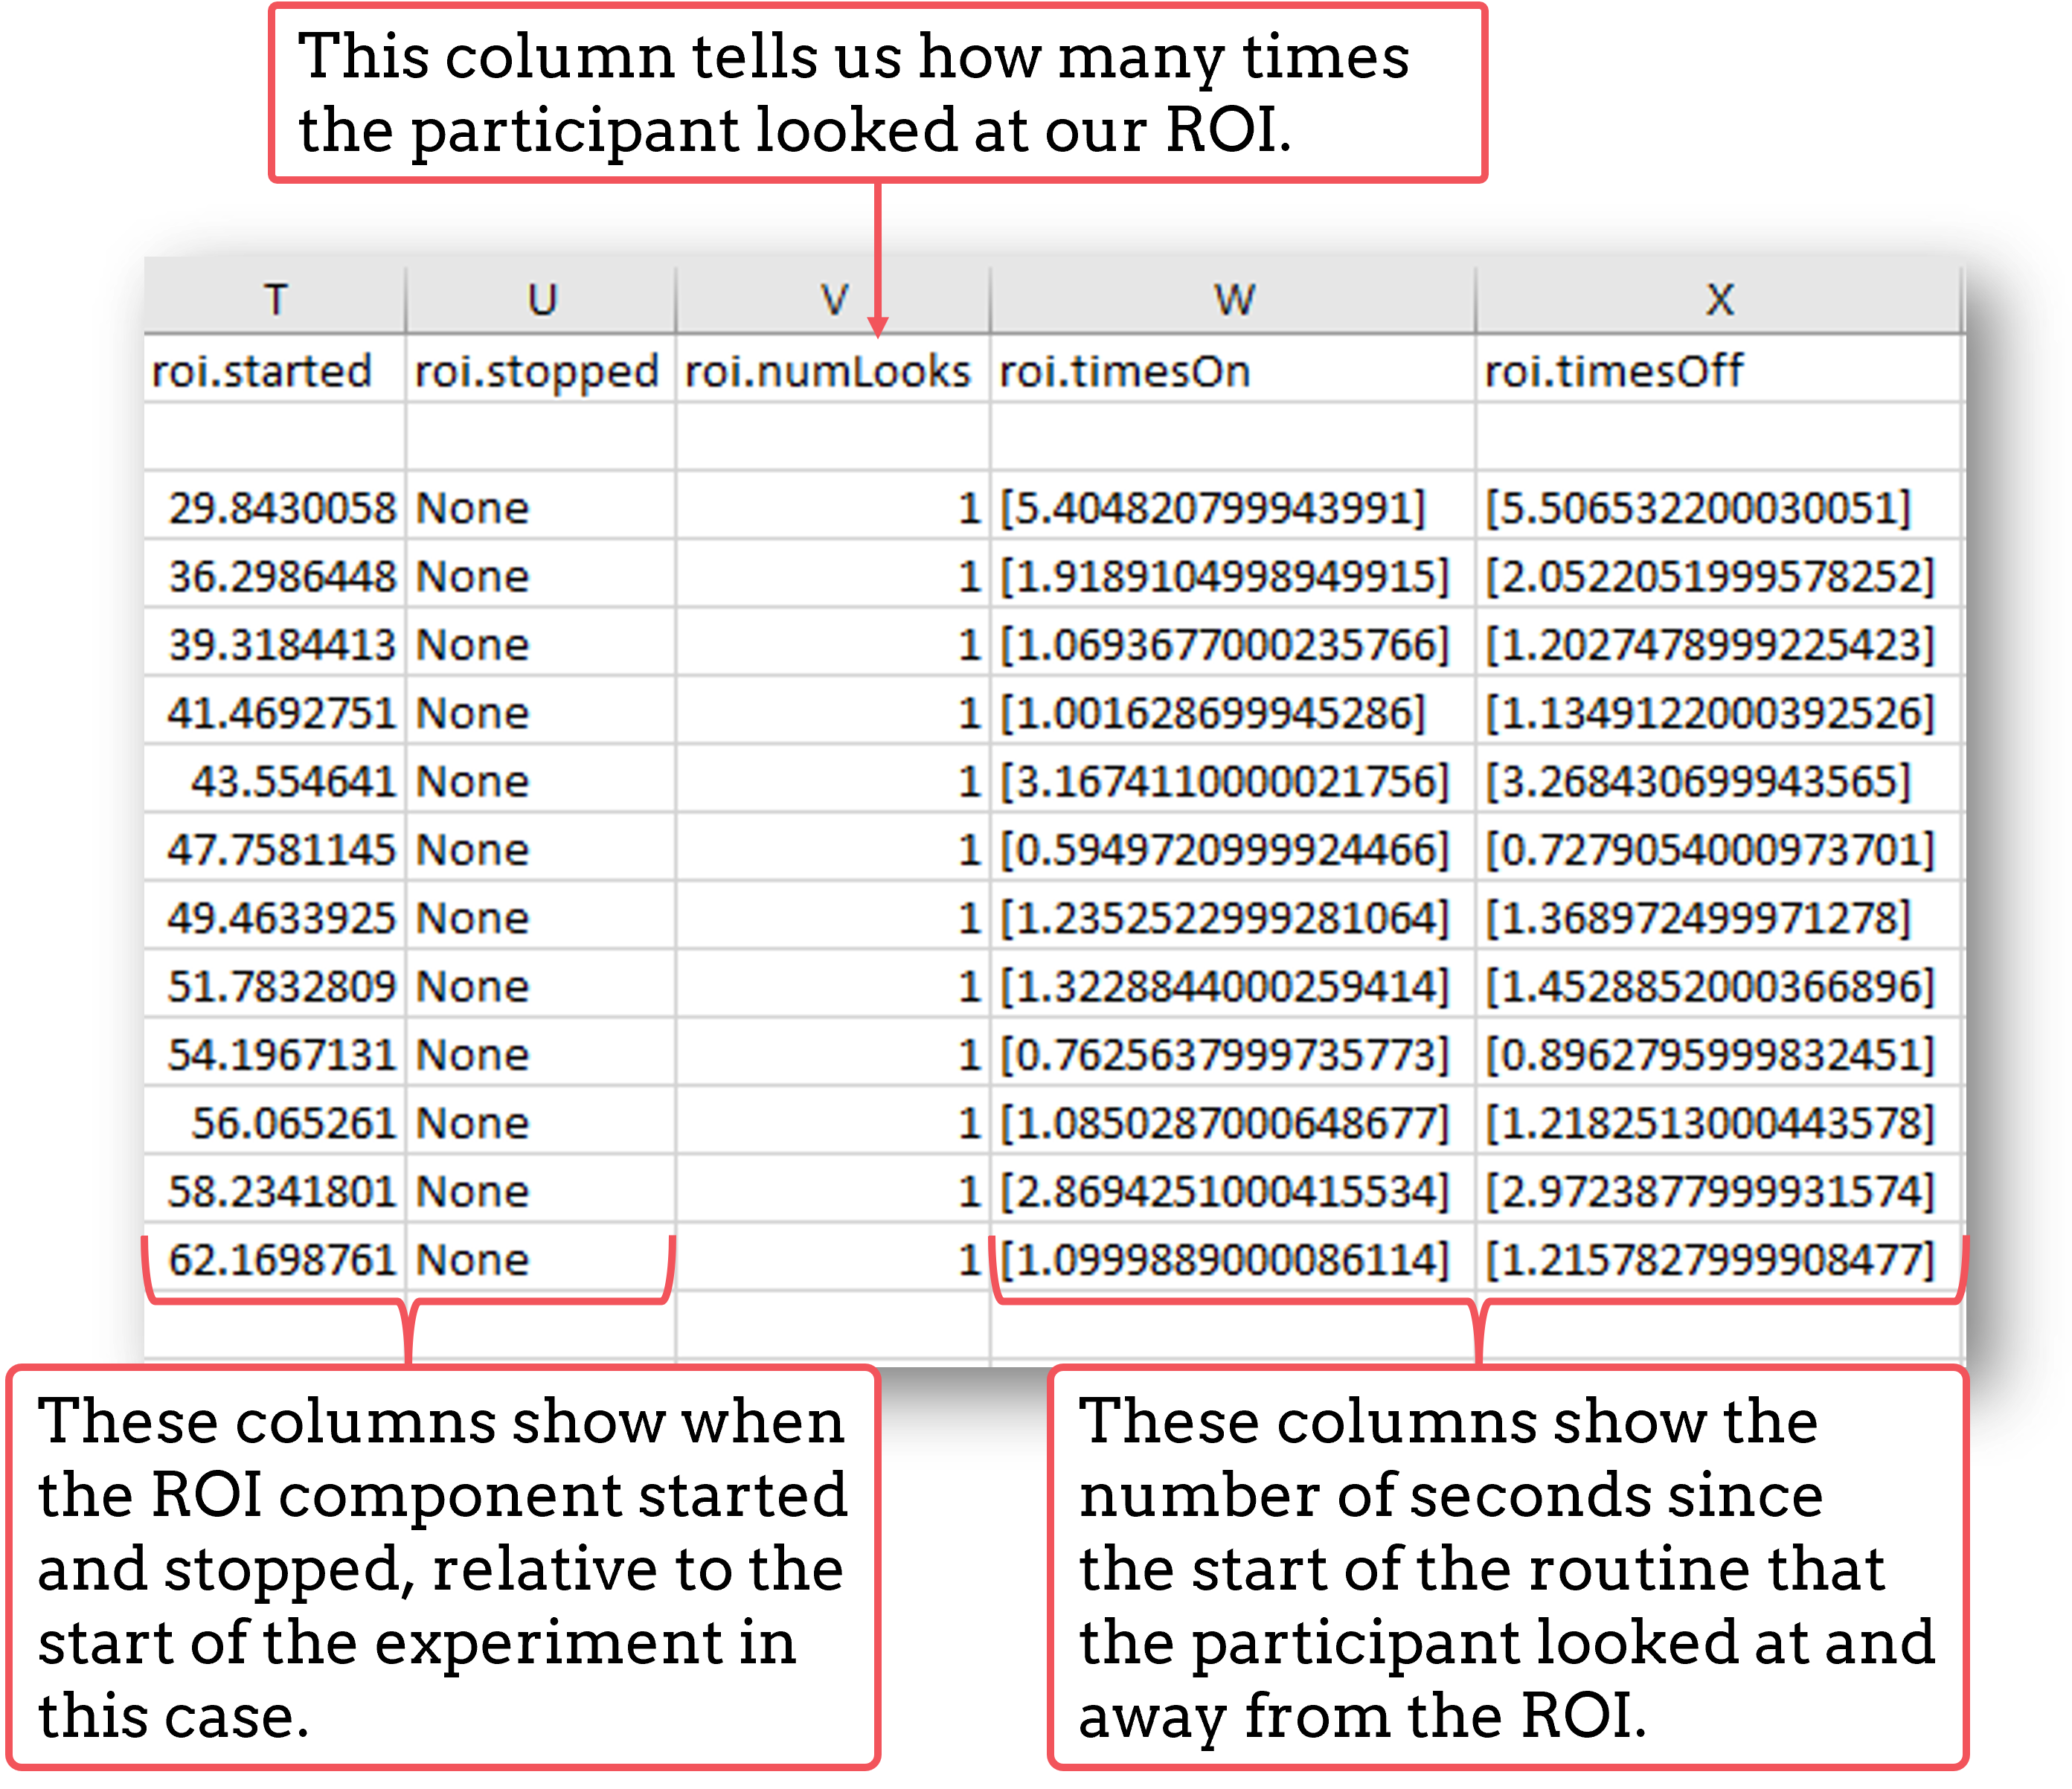
Fig. 46 The data output will vary according to what you’ve asked PsychoPy to record about gaze.
PsychoPy also provides the option to save your eyetracking data as a hdf5 file, which is particularly useful if you are recording a large amount of eyetracking data, such as gaze position on every frame for example.
To save eyetracking data as a hdf5 file, just click on the Experiment Settings icon, and in the ‘Data’ tab check the box next to ‘Save hdf5 file’. Hdf5 files can be inspected using a free software such as hdfView or, alternatively, you can extract data from your hdf5 files using the python h5py library. For example, the code below could be used to write data stored in a hdf5 file to a csv using a combination of h5py and pandas:
import h5py
import pandas as pd

filename = "data/becca2_becca_track_2022-12-12_17h36.27.977.hdf5"
id = filename.split("/")[1].split("_")[0]
with h5py.File(filename, "r") as f:

    # get the list of eyetracker measures available in the hdf5
    eyetracker_measures = list(f['data_collection']['events']['eyetracker'])

    for measure in eyetracker_measures:
        print('Extracting events of type: ', measure)
        data_collection = list(f['data_collection']['events']['eyetracker'][measure])
        if len(data_collection)>0:
            column_headers = data_collection[0].dtype.descr
            cols = []
            data_dict = {}
            for ch in column_headers:
                cols.append(ch[0])
                data_dict[ch[0]] = []

            for row in data_collection:
                for i, col in enumerate(cols):
                    data_dict[col].append(row[i])
            pd_data = pd.DataFrame.from_dict(data_dict)
            pd_data.to_csv(id+'_'+measure+'.csv', index = False)
        else:
            print('No data for type', measure, ' moving on')
Finally, you could plot data from the above, for instance, as a heatmap:
import pandas as pd
import matplotlib.pyplot as plt
import numpy as np

filename = '2_BinocularEyeSampleEvent.csv'

# read as pandas dataframe
data = pd.read_csv(filename)

# convert pandas arrays to no arrays
x = data['left_gaze_x'].to_numpy()
y = data['left_gaze_y'].to_numpy()

# remove nan values
x = x[~np.isnan(x)]
y = y[~np.isnan(y)]

# plot x and y values as a heat map
heatmap, xedges, yedges = np.histogram2d(x, y, bins=50)
extent = [xedges[0], xedges[-1], yedges[0], yedges[-1]]

# show the plot
plt.clf()
plt.imshow(heatmap.T, extent=extent, origin='lower')
plt.show()
If there is a problem - We want to know!
If you have followed the steps above and are having an issue, please post details of this on the PsychoPy Forum.
We are constantly looking to update our documentation so that it’s easy for you to use PsychoPy in the way that you want to. Posting in our forum allows us to see what issues users are having, offer solutions, and to update our documentation to hopefully prevent those issues from occurring again!